Lecture: Using social media metrics. (Guest lecturer: Verity Trott)
Reading:
Baym, N. K. (2013). Data not seen: The uses and shortcomings of social media metrics. First Monday, 18(10), 1–16.
Tutorial: What can social media analytics measure and how?
Activity 1:
Before the tutorial, note several (five would be very good!) instances where you responded to material online. Pay attention to the following aspects of what you do:
- What are you responding to (text, image, sound, something else?)
- What platform is the material on (Facebook, Instagram etc)?
- What was the nature of your response (like, share, comments, etc)?
When you come to class, you should be prepared to present two of your examples to the group focusing on whether the platform affected the nature of your response and whether and how your level of engagement with the original material is reflected in your response.
Questions for general discussion:
- Do we respond differently on different platforms as a result of the possibilities which they offer?
- Is the value of a particular sort of response the same across different platforms? (i.e. is a reaction on Facebook equivalent to a reaction on Instagram?) If you can identify cases where you think there is a difference, why do you think that might be?
- Can we rank different kinds of response in a way which reflects our level of engagement? Would such a scale be general or platform-specific?
Activity 2:
Go to this page which gives information about trending hashtags for twitter in Australia. Look at the most recent list.
How many of the listed hashtags are clearly about politics? (You may need to have a look at some of the threads to get a clear sense of this.)
Choose one of the political hashtags and have a look at the thread. Gather information about the following questions:
- Is this thread a general one, or is it tied to a specific political issue?
- To what extent do you think a range of views is being expressed? Try to take the first twenty messages and assign them to categories (in favour of X, against X) – how difficult is it to do this?
The page you started from does not tell us how the rankings are decided. Some sort of counting is certainly involved, but there are a couple of possibilities as to how that is done (number of tweets in a period of time, proportion on every 1000 tweets, who knows?). However it is derived, this is a useful number for assessing relative prominence of topics, but how much does it tell us beyond that? (some additional questions to think about here: how many twitter users are there in Australia? How many tweets are sent per hour?)
Discussion Questions:
- Could you use the information you found on twitter as evidence for analysing politics? Which sorts of information (quantitative, qualitative) could be used for what purposes?
- Do you think that assessing level of engagement by ranking types of response and then counting them is valid?
- Or is this a point (as Bahm suggests in the end) where the digital and the humanistic part company?
Web skills:
html has limited possibilities for placing material on a page – spaces and line breaks basically. One way to have better control over layout is to use tables with invisible borders. Today’s exercise will walk you through this process.
- Start a new page in SeaMonkey. Add some text then add an image on the same line, then more text. How does everything get aligned? Add more text before the image until the line wraps – what happens?
- Go to the end of your content and insert a line break. Then either click on the Table icon on the tool bar, or select Insert > Table. The dialogue which opens gives a 2 x 2 table as default and that is fine to start. But we want invisible borders and to achieve that, you need to change the Border setting to 0. Apply the changes – you will see the table appear on your page with red dotted borders, which means that they will not be visible in a browser.
- Move you pieces of text and your image into cells in the table. For an image, you can select it and then drag and drop; text has to be selected then cut and paste to the cells.
- Save the page and preview it – how does it look? Go back to the edit window so we can make some improvements.
- Things we can do now to get the layout we want:
- Change the size of the table by dragging the tools on the edges.
- Change the position of the content in a cell: position your cursor inside the cell then right click. Choose Table Cell Properties and then set Vertical or Horizontal Content Alignment (or both). (Note that in this dialogue you can also set cell size, background colour and other properties.)
- Add more text into the cells to see how the layout is maintained.
- The menu which appears when you right click from inside a table cell also makes other formatting options available:
- Table Insert to add rows, columns or cells
- Table Delete to delete rows, columns or cells
- Join with cell to the right to join two cells
- Split cell (if you have already joined cells)
For complex layout, it is usually a good idea to work out what the structure you need in a table to place everything properly: how many rows? how many cells in each row?
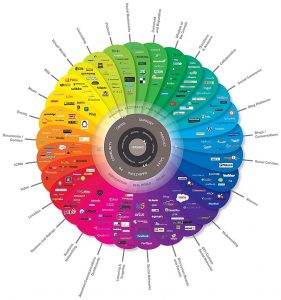
Image credit: The Conversation Prism by Brian Solis and JESS3